

By SJS Investment Services Senior Advisor Kirk Ludwig CFIP, AIF®.
When it comes to the financial markets, there’s always something to worry about. In today’s “uncertain” market, people are worried about the COVID resurgence, stock market valuations, long-term trend of inflation, the Fed’s plans on monetary and fiscal policy, potential tax law changes, and debt ceiling negotiations. Many investors become so worried about risks and uncertainty that they sell out of the market.
Yet risk is the nature of markets, and that’s a good thing! Can you imagine a stock market with nothing to worry about? It would essentially mean there would be no perceived risk for investors. What’s the expected return for investments with little or no risk?
The One-Month Treasury Bill is considered one of the lowest risk investments available in the public markets and carries an annual yield of 0.03% as of October 12, 2021.[1] In this case, the expected return for little or no perceived risk is near 0%. There’s a simple rule in investing – risk and return are related! If you want return, there must be a level of risk you’re willing to accept.

Source: Avantis Investors, Bloomberg, as of 30-Sep-2021. The US Treasury yield curve compares the yields of maturities from short-term Treasury bills (<1 year) to long-term Treasury notes and bonds (>10 years).
People dislike risk because they are worried about the uncertainty of the future. Yet from a broadly-diversified investing perspective, the greater the uncertainty, the higher the risk. Investors expect to be appropriately compensated for accepting risk. An investor who owns a One-Month Treasury Bill understands there’s very little to worry about when it comes to volatility, and agrees to give up expected return for the comfort of safety. We want stock market investors to understand that while the value of their investments can drop rapidly at times, investors tend to benefit significantly from this risk in stocks over the long-run.
For example, when COVID-19 first started spreading in the US, the S&P 500 fell roughly 34% from February 19, 2020 through March 23, 2020.[2] Even before the US reached its highest spike in COVID cases, the market started rebounding, and this year has continued to set new record highs.[2][3] As of October 12, 2021, the S&P 500 is up roughly 95% since the lows set on March 23, 2020.
Even with their knowledge of financial history, some investors are currently worried that the US stock market is overvalued. The Price / Earnings (P/E) ratio of the S&P 500 is around 25, which places this time period in the top 5 percentile of historical market valuations since 1930.[4] However, not all sectors of the US economy have equally high valuations. For example, the mega-cap growth space, driven by the FAAMG stocks, has a P/E around 39.[5] Conversely, the small value space, which is heavily weighted with financials and energy companies, has a P/E around 14.[6] As this accompanying graph demonstrates, the valuation spreads between growth and value stocks are near record highs around the world.[7]
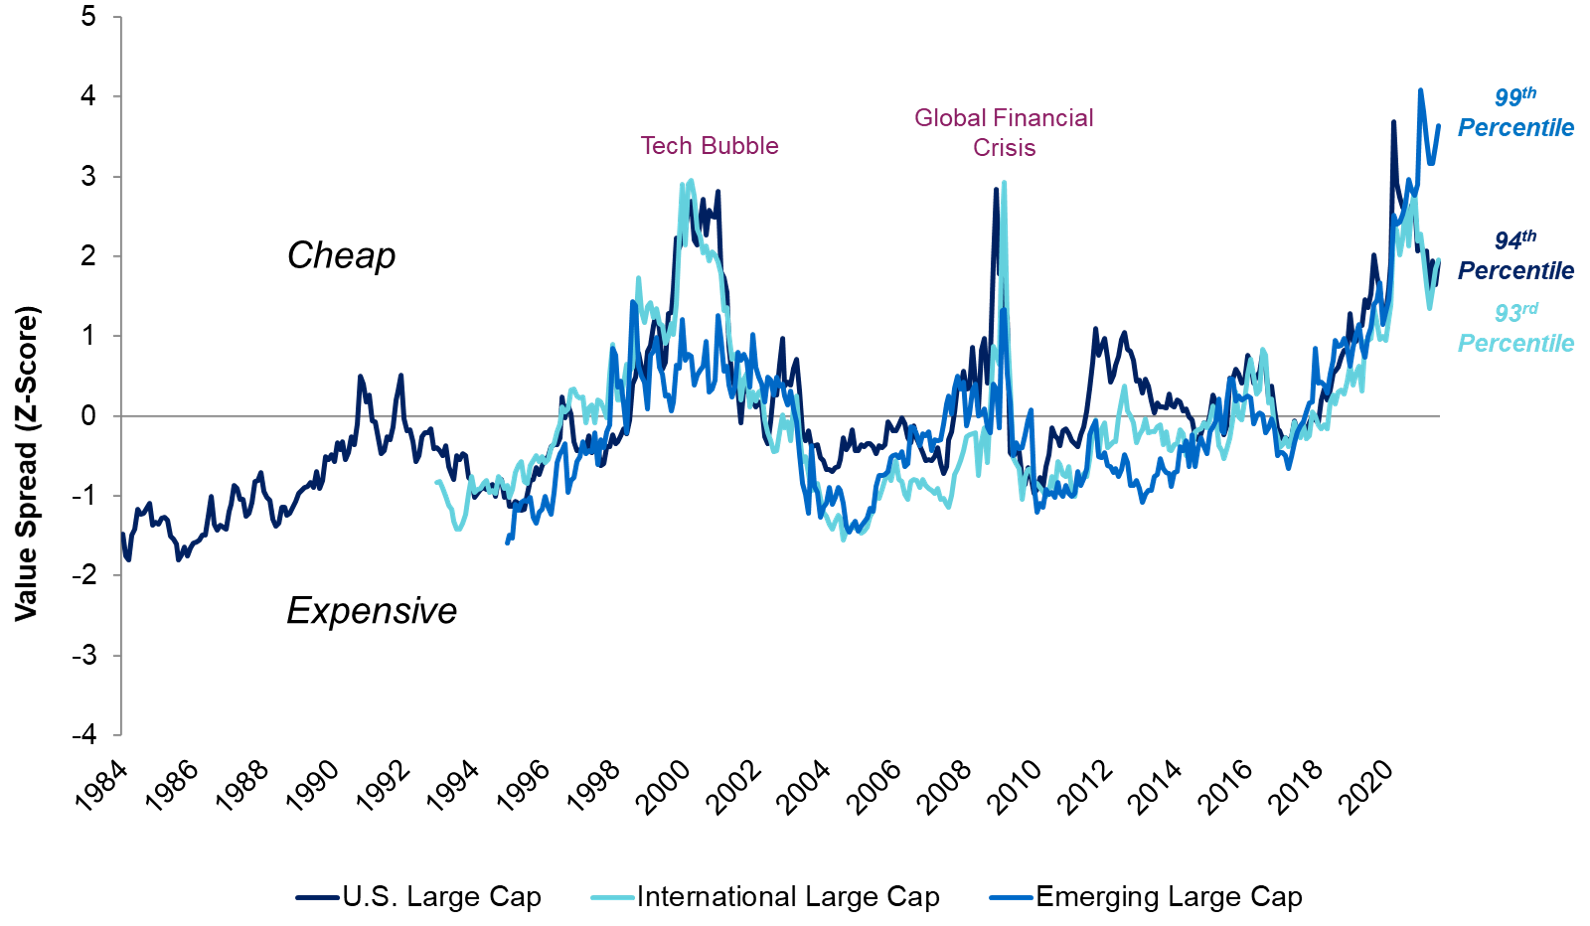
Source: “Are Value Stocks Cheap for a Fundamental Reason?”. AQR Capital Management, 30-Aug-2021, aqr.com. Spreads are constructed using the Hypothetical AQR U.S. Large Cap, International, and Emerging Valuation Theme Models, and are adjusted to be dollar-neutral, but not necessarily beta-neutral through time. For illustrative purposes only and not representative of an actual portfolio AQR currently manages.
General market commentary doesn’t always capture the full picture of the markets. When you dig further into the details, you’ll often find a different story.
Given all of this information, we do not anticipate a major stock market correction in the short-term. But markets are unpredictable, and it’s possible a stock market correction may occur. If so, we don’t think that you should be alarmed, because stock market corrections are relatively common.[8] Since 1946, the S&P 500 has experienced a 5% drawdown every 7 months on average.[8] Similarly, 10% corrections have occurred every 22 months, and 20% corrections every 76 months (6.33 years) on average.[8] Despite all of these corrections, the S&P 500 has continued to march onward, returning 11% annually since 1946.[4]
In summary, there’s always something to worry about, but it’s rare that a well-known issue causes a major stock market correction. Most issues are well-known and analyzed by markets participants at every moment. Typically, it’s a surprise event that serves as the catalyst for a market selloff. Despite all of the surprise events of the past, global stock markets have remained resilient and have rewarded investors over the long-run.[9]
We believe that the best course of action for managing unexpected events is through controlling what you can, such as broad diversification with the appropriate balance of growth and stability in your portfolio. You can use market volatility as an opportunity to rebalance to your target asset allocation. As certain asset classes increase in value, you can look to reduce exposure, and as asset classes decline in value, you can look to add; the simple notion of selling high and buying low. There might also be an opportunity for tax loss harvesting.
By focusing on the long-term goals of your portfolio, you can reduce the temptation of making major changes based on short-term news events. There will always be something to worry about, but with the right portfolio design and disciplined approach, you can whether almost any storm.
Important Disclosure Information & Sources:
[1] “Daily Treasury Yield Curve Rates“. U.S. Department of the Treasury, 12-Oct-2021, treasury.gov.
[2] “S&P 500 (^GSPC)“. Yahoo Finance, 12-Oct-2021, finance.yahoo.com.
[3] “COVID-19 Projections”. Institute for Health Metrics and Evaluation, healthdata.org.
[4] “S&P 500”. Morningstar Direct, January 1930 - September 2021.
[5] “CRSP US Mega Cap Growth Index“. Morningstar Direct, 30-Sep-2021. The CRSP US Mega Cap Growth Index includes the largest U.S. companies, with a target of including the top 70% of investable market capitalization, ranked by various metrics to consider valuations.
[6] “CRSP US Small Cap Value Index“. Morningstar Direct, 30-Sep-2021. The CRSP US Small Cap Value Index focuses on the bottom 2% - 15% of US stocks by market capitalization, ranked by various metrics to consider valuations.
[7] “Are Value Stocks Cheap for a Fundamental Reason?“. AQR Capital Management, 30-Aug-2021, aqr.com.
[8] “Putting Pullbacks in Perspective“. Guggenheim Investments, August 2021, guggenheiminvestments.com.
[9] “Stocks for the Long Run”. Jeremy Siegel, 2014, Wharton School Press.
There is no guarantee investment strategies will be successful. Past performance is no guarantee of future results. Diversification neither assures a profit nor guarantees against a loss in a declining market.
Statements contained in this article that are not statements of historical fact are intended to be and are forward looking statements. All forward looking statements are inherently uncertain as they are based on various expectations and assumptions concerning future events and they are subject to numerous known and unknown risks and uncertainties which could cause actual events or results to differ materially from those projected.
Indices are not available for direct investment. Index performance does not reflect the expenses associated with management of an actual portfolio. Index performance is measured in US dollars. The index performance figures assume the reinvestment of all income, including dividends and capital gains. The performance of the indices was obtained from published sources believed to be reliable but which are not warranted as to accuracy or completeness.
Hyperlinks to third-party information are provided as a convenience and we disclaim any responsibility for information, services or products found on websites or other information linked hereto.